Bull Market Third Years
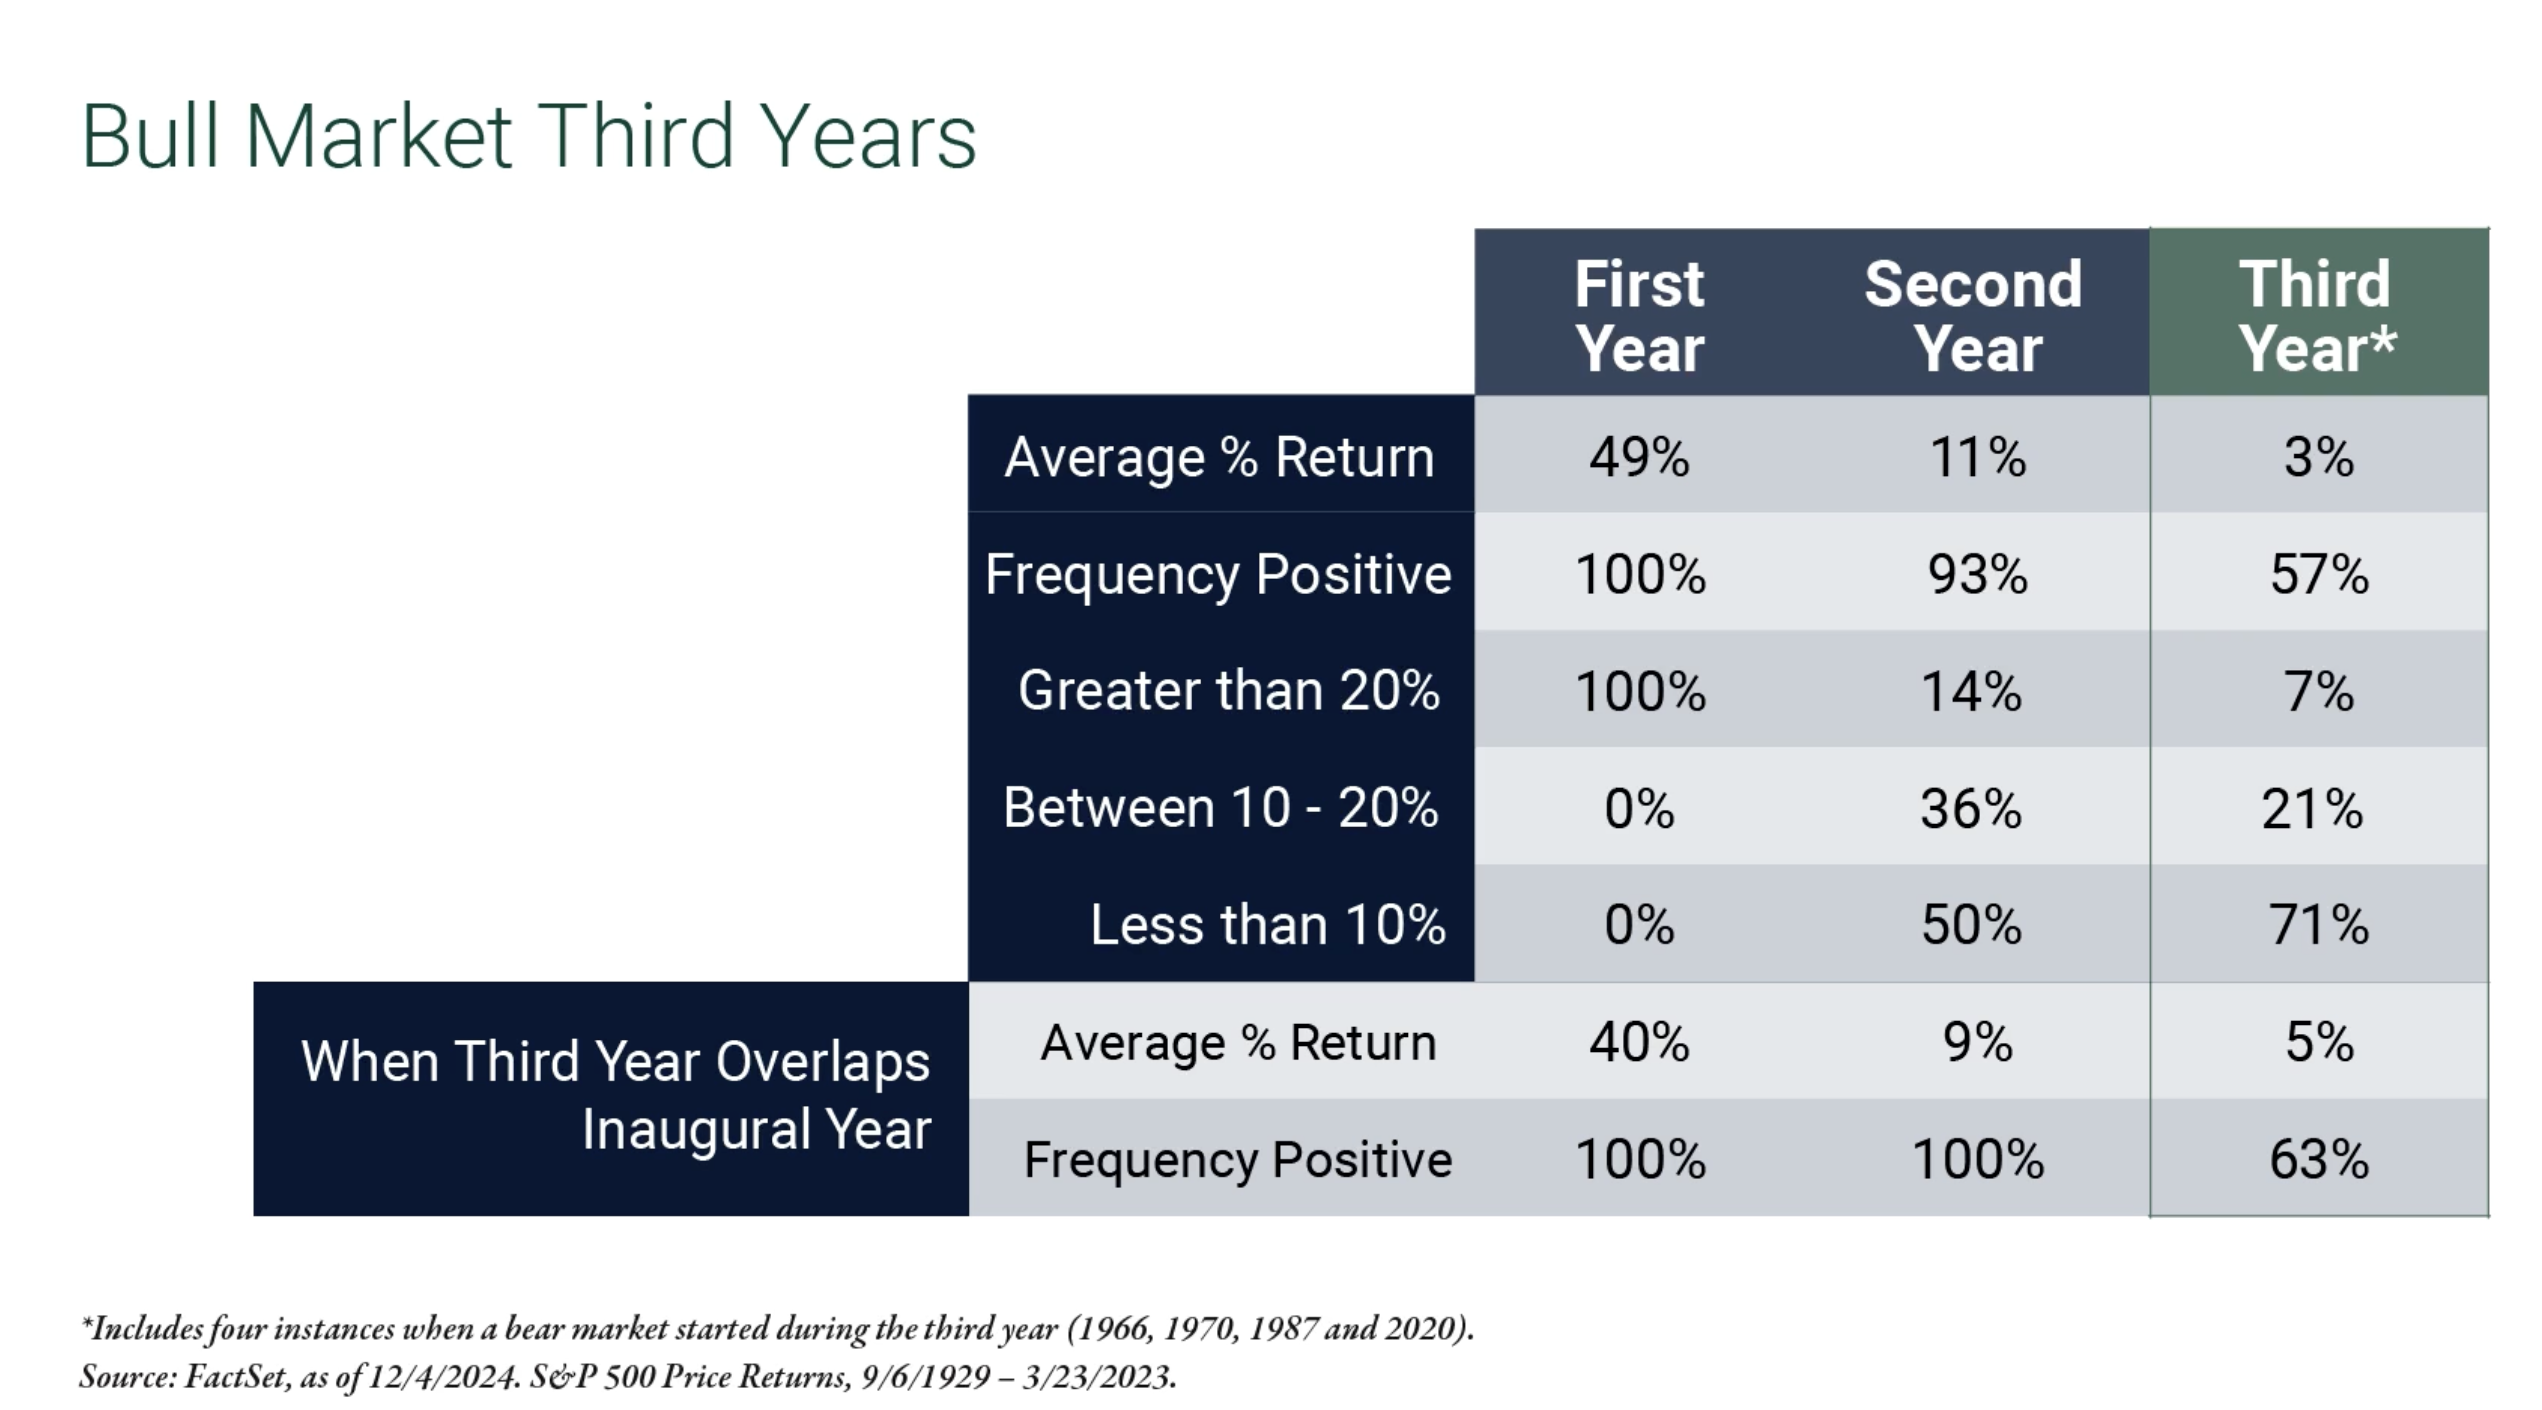
This table provides insights into the historical performance of bull markets over their first, second, and third years, with particular focus on average returns and the frequency of positive outcomes.
Key Observations
First Year:
• The average return is an impressive 49%, with a 100% frequency of positive performance.
• In this phase, 100% of returns exceed 20%, showcasing the strength and momentum typical of the early stages of a bull market.
Second Year:
• The average return drops to 11%, with a 93% frequency of positive outcomes.
• Only 14% of returns exceed 20%, while 36% fall between 10–20%, and 50% are under 10%.
• This indicates a slowing of growth compared to the first year but still predominantly positive outcomes.
Third Year:
• The average return further decreases to 3%, and the frequency of positive outcomes declines to 57%.
• Only 7% of returns exceed 20%, while 21% fall between 10–20%, and the majority (71%) are below 10%.
• This shows that the third year often represents a plateau or cooling-off period in bull markets.
Third-Year Overlaps with Inaugural Years:
• When a bull market’s third year overlaps with an inaugural year of a new market phase (e.g., after a bear market), the average return is 40%, with 100% frequency of positive outcomes.
• This overlap represents rare instances where the third year benefits from renewed market strength.
Summary
The data highlights that bull market performance typically diminishes over time, with the first year being the most explosive. By the third year, returns are significantly lower, with positive outcomes less likely. However, unique cases where the third year coincides with a new market phase can still deliver substantial gains.